

I’m writing this in the final week of my current role as Research Development Manager (Social Sciences) at the University of Nottingham before I move to my role as Research Development Manager (Research Charities) at the University of Nottingham. This may or may not change the focus of this blog, but I won’t abandon the social sciences entirely – not least because I’m stuck with the web address.

I’ve been thinking about strategies and approaches to research funding, and the place and prioritisation of applying for research grants in academic structures. It’s good for institutions to be ambitious in terms of their grant getting activities. However, these ambitions need to be at least on a nodding acquaintance with:
(a) the actual amount of research funding historically available to any given particular discipline; and
(b) the chances of any given unit or school or individual to compete successfully for that funding given the strength of the competition.
To use a football analogy, if I want my team to get promotion, I should moderate my expectations in the light of how many promotion places are available, and how strong the likely competition for those limited spots will be. In both cases, we want to set targets that are challenging, stretching, and ambitious, but which are also realistic and informed by the evidence.
How do we do that? Well, in a social science context, a good place to start is the ESRC success rates, and other disciplines could do worse than take a similar approach with their most relevant funding council. The ESRC produce quite a lot of data and analysis on funding and success rates, and Alex Hulkes of the ESRC Insights team writes semi-regular blog posts. Given the effort put into creating and curating this information, it seems only right that we use it to inform our strategies. This level of transparency is a huge (and very welcome) change from previous practices of very limited information being rather hidden away. Obvious caveats – the ESRC is by no means the only funder in town for the social sciences, but they’re got the deepest pockets and offer the best financial terms. Another (and probably better) way would be to compare HESA research income stats, but let’s stick to the ESRC for now.
The table below shows the running three year total (2015/6- 2017/18) and number of applications for each discipline for all calls, and the total for the period 2011/12 to 2017/8. You can access the data for yourself on the ESRC web page. This data is linked as ‘Application and success rate data (2011-12 to 2017-18)’ and was published in ODS format in May 2018. For ease of reading I’ve hidden the results from individual years.
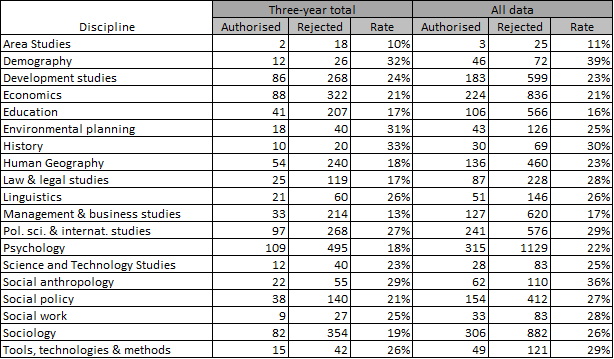
Lots of caveats here. Unsuccessful outline proposals aren’t included (as no outline application leads directly to funding), but ‘office rejects’ (often for eligibility reasons) are. The ‘core discipline’ of each application is taken into account – secondary disciplines are not. The latest figures here are from 2017-2018 (financial year), so there’s a bit of a lag – in particular, the influence of the Global Challenges Research Fund (GCRF) or Industrial Strategy Challenge Fund (ISCF) will not be fully reflected in these figures. I think the ‘all data’ figures may include now-defunct schemes such as the ESRC Seminar Series, though I think Small Grants had largely gone by the start of the period covered by these figures.
Perhaps most importantly, because these are the results for all schemes, they include targeted calls which will rarely open to all disciplines equally. Fortunately, the ESRC also publishes similar figures for their open call (Standard) Research Grants scheme for the same time period. Note that (as far as I can tell) the data above includes the data below, just as the ‘all data’ column (which goes back to 2011/2) also includes the three year total.
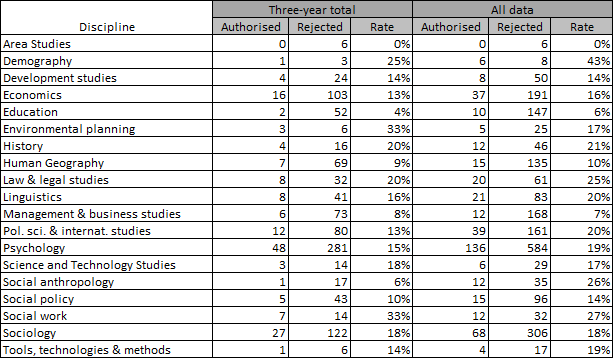
This table is important because the Research Grants Scheme is bottom-up, open-call, and open to any application that’s at least 50% social sciences. Any social science researcher could apply to this scheme, whereas directed calls will inevitably appeal only to a subset. These are the chances/success rates for those whose work does not fit squarely into a directed scheme and could arguably be regarded as a more accurate measure of disciplinary success rates. It’s worth noting that a specific call that’s very friendly to a particular discipline is likely to boost the successes but may decrease the disciplinary success rate if it attracts a lot of bids. It’s also possible that major targetted calls that are friendly to a particular disciplin may result in fewer bids to open call.
To be fair, there are a few other regular ESRC schemes that are similarly open and should arguably be included if we wanted to look at the balance of disciplines and what a discipline target might look like. The New Investigator Scheme is open in terms of academic discipline, if not in time-since-PhD, and the Open Research Area call is open in terms of discipline if not in terms of collaborators. The Secondary Data Analysis Initiative is similarly open in terms of discipline, if not in terms of methods. Either way, we don’t have (or I can’t find) data which combines those schemes into a non-directed total.
Nevertheless, caveats and qualifications aside, I think these two tables give us a good sense of the size of prize available for each discipline. There’s approxinately 29 per year (of which 5 open call) for Economics, and 11 per year (of which 2 open call) for Business and Management. Armed with that information and a knowledge of the relative strength of the discipline/school in our own institution, we ought to get a sense of what a realistic target might look like and a sense of how well we’re already doing. Given what we know about our expertise, eminence, and environment, and the figures for funded projects, what ought our share of those projects be?
We could ask a further question about how those successes are distributed between universities and about any correllation between successes and (unofficial) subject league tables from the last REF, calculated on the basis of Grade Point Average or Research power. However, even if that data were available, we’d be looking at small numbers. We do know that the ESRC have done a lot of work on looking at funding distribution and concentration and their key findings are that:
ESRC peer review processes do not concentrate funding to a degree greater than that apparent in the proposals that request the funding.
ROs which apply infrequently appear to have lower success rates than do those which are more active applicants
In other words, most universities typically have comparable succcess rates except that those that apply more often do a little better than average, those who apply rarely do a little worse. This sounds intuitively right – those who apply more are likely more research-active, at least in the social sciences, and therefore more likely to generate stronger applications. But this is at an overall level, not discipline level.
I’d also note that we shouldn’t only measure success by the number of projects we lead. As grants get larger on average, there’s more research income available for co-investigators on bids leds elsewhere. I think a strategy that focuses only on leading bids and being lead institution neglects the opportunties offered by being involved in strong bids led by world class researchers based elsewhere. I’m sure it’s not unusual for co-I research income to exceed PI income for academic units.
I’ve not made any comment about the different success rates for different disciplines. I’ve written about this already for many of the years covered by the full data (though Alex Hulkes has done this far more effectively over the last few years, having the benefit of actual data skills) and I don’t really want to cover old ground again. The same disparities continue much as before. Perhaps GCRF will provide a much-needed boost for Education research (or at least the international aspects) and ISCF for management and business research.
Maybe.